Autor des Abschnitts: Rebecca Vederhus, Sebastian Jentschke
Von SPSS zu jamovi: Korrelation
This comparison shows how a Kendall’s tau correlation is conducted in SPSS and jamovi. The SPSS test follows the description in chapter 8.4.4 in Field (2017), especially output 8.3. It uses the data set The Biggest Liar.sav which can be downloaded from the web page accompanying the book.
SPSS |
jamovi |
|---|---|
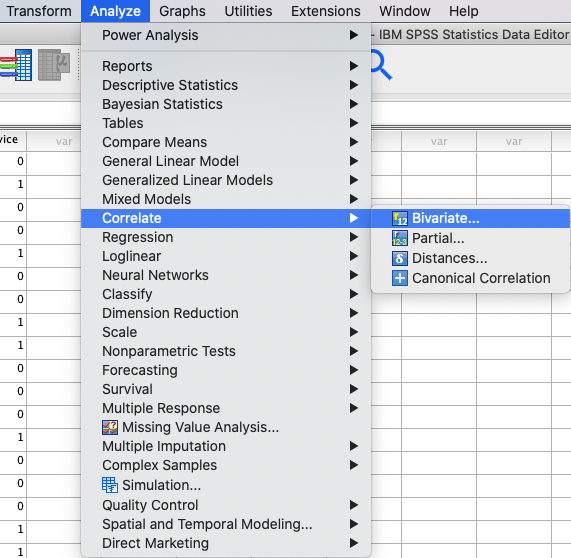
In SPSS können Sie eine Korrelation durchführen: |
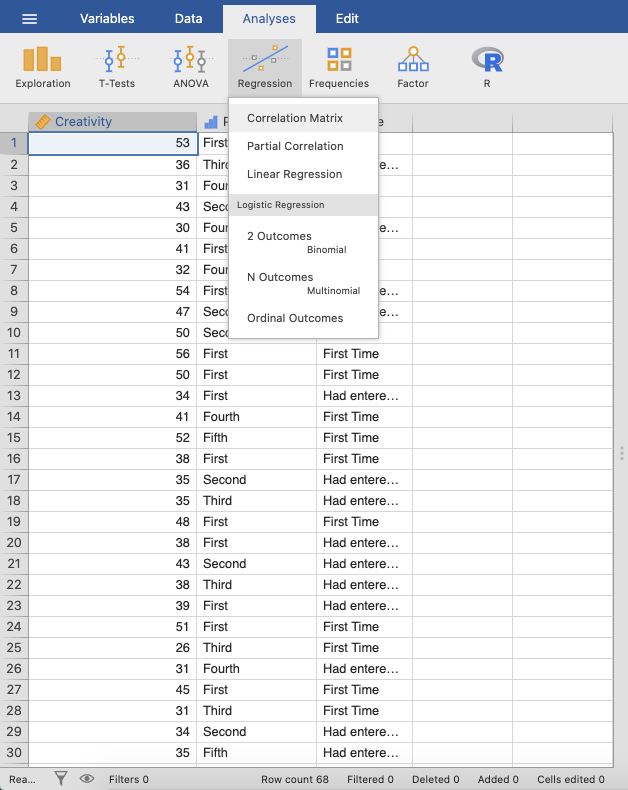
In jamovi you do this using: |
|
|
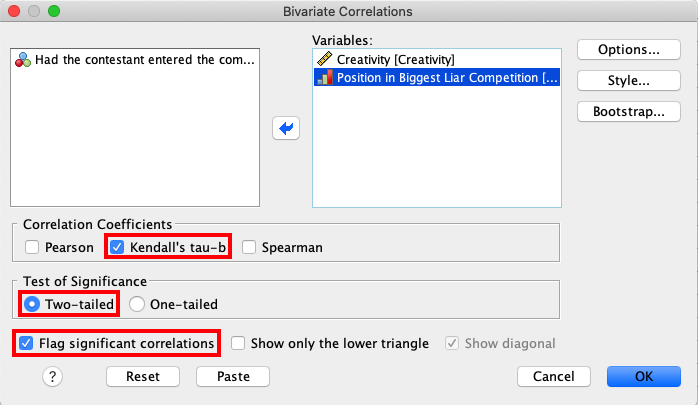
In SPSS, move the variables |
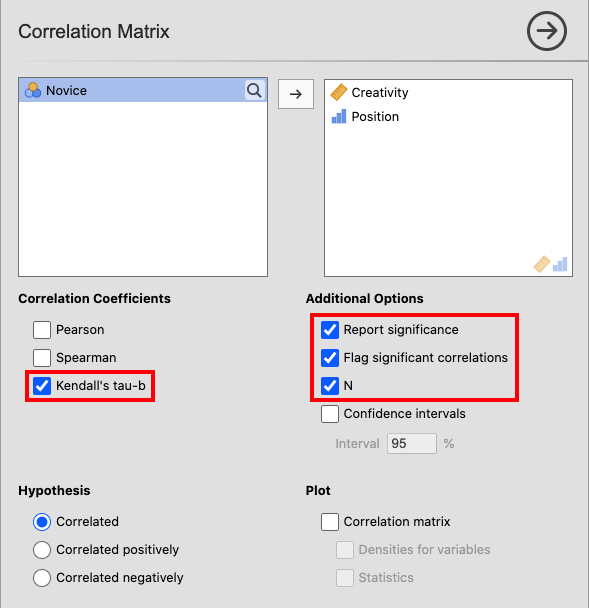
In jamovi, move the variables |
|
|
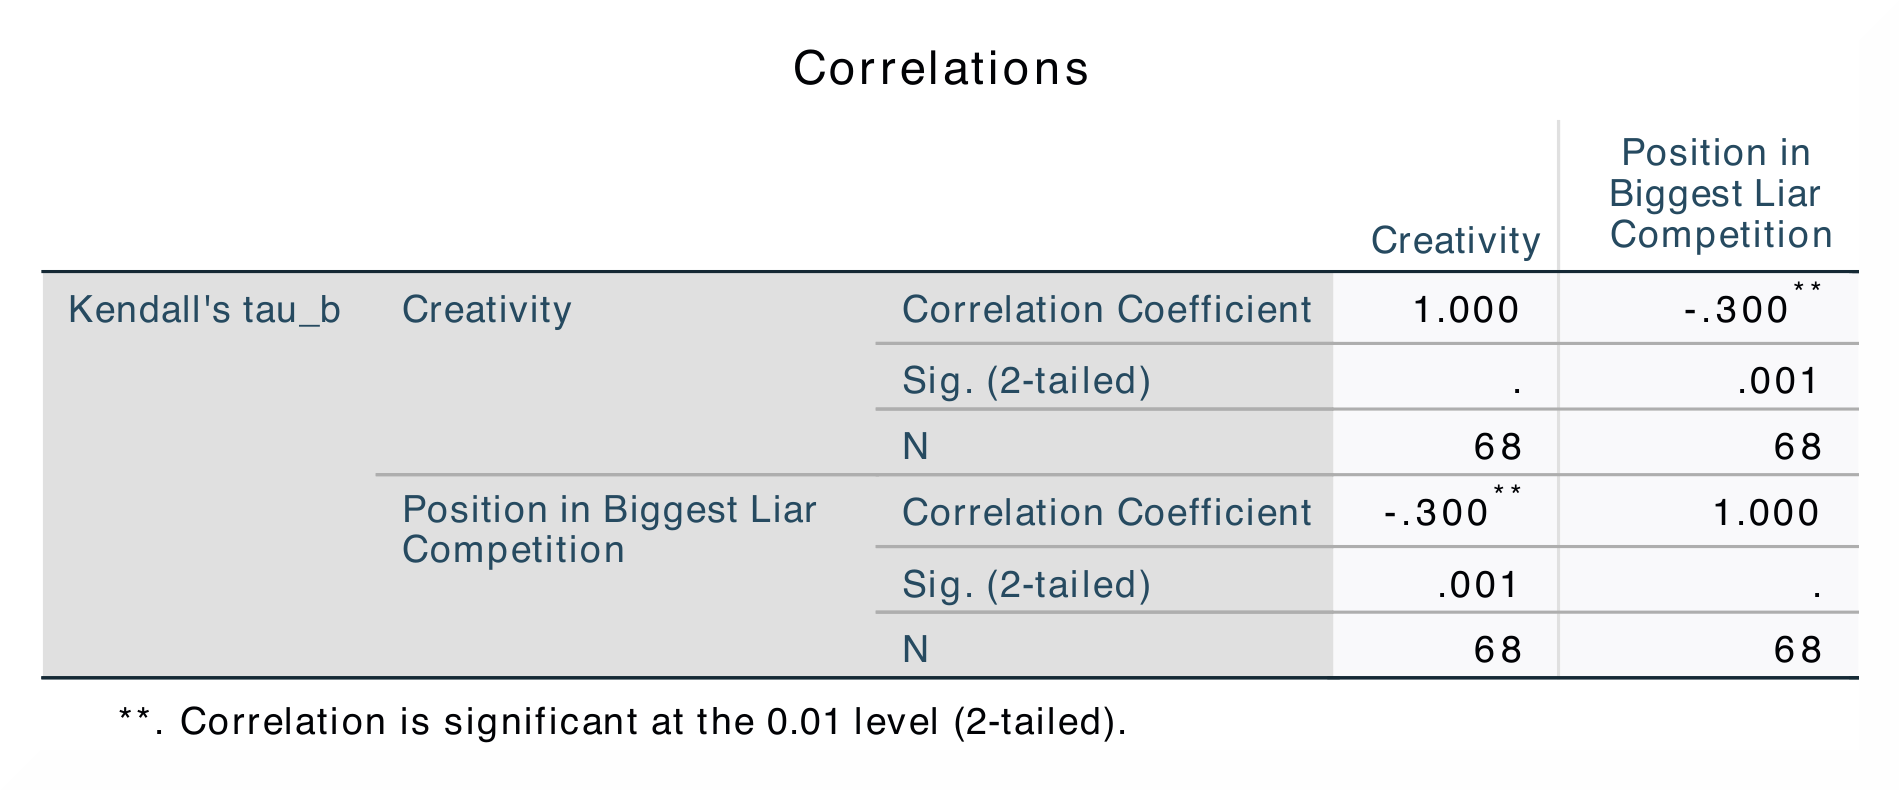
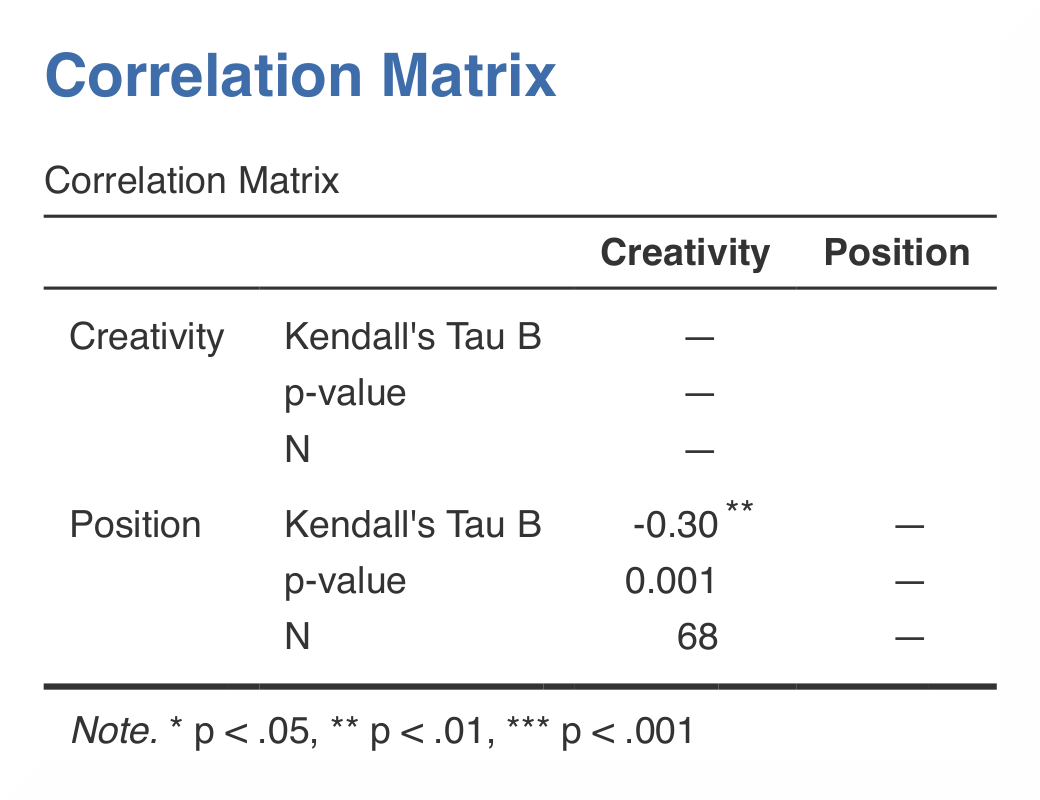
The results in SPSS and jamovi are identical. |
|
|
|
In SPSS können Sie feststellen, ob eine Korrelation signifikant ist, indem Sie die Anzahl der Sternchen hinter dem Korrelationskoeffizienten notieren. Die Korrelationsmatrix zeigt den Korrelationskoeffizienten, den p-Wert und den Stichprobenumfang (N) an. |
jamovi kennzeichnet signifikante Korrelationen in Übereinstimmung mit dem APA-Stil mit einem (p < .05), zwei (p < .01) oder drei (p < .001) Sternchen. Im Gegensatz dazu werden in SPSS alle Korrelationen über dem Niveau von p < .01 einfach mit zwei statt drei Sternchen gekennzeichnet. |
The correlation coefficient is found both underneath and over the diagonal in SPSS, while in jamovi the coefficient is only shown underneath. The numerical values for the statistics are the same: r = -.30, p < .01. |
|
Wenn Sie diese Analysen mit Hilfe der Syntax replizieren möchten, können Sie die unten stehenden Befehle verwenden (in jamovi kopieren Sie einfach den unten stehenden Code in Rj). Alternativ können Sie auch die SPSS-Ausgabedateien und die jamovi-Dateien mit den Analysen unterhalb der Syntax herunterladen. |
|
NONPAR CORR
  /VARIABLES=Creativity Position
  /PRINT=KENDALL TWOTAIL NOSIG FULL
  /MISSING=PAIRWISE.
|
jmv::corrMatrix(
    data = data,
    vars = vars(Creativity, Position),
    pearson = FALSE,
    kendall = TRUE,
    flag = TRUE,
    n = TRUE)
|