Autor des Abschnitts: Sebastian Jentschke
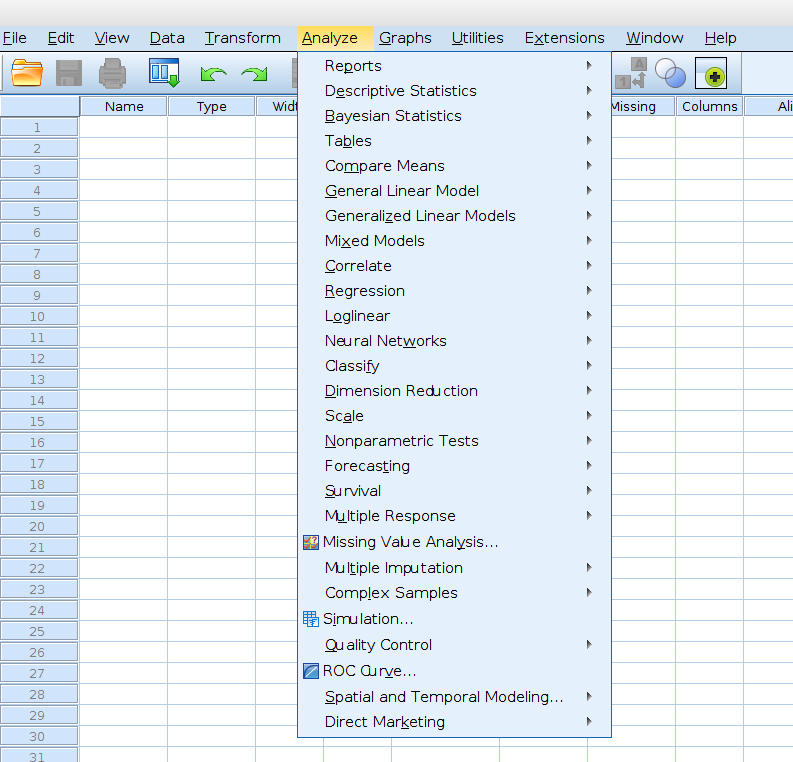
Vergleich, welche Analysen in SPSS und jamovi verfügbar sind
SPSS |
jamovi |
|---|---|
|
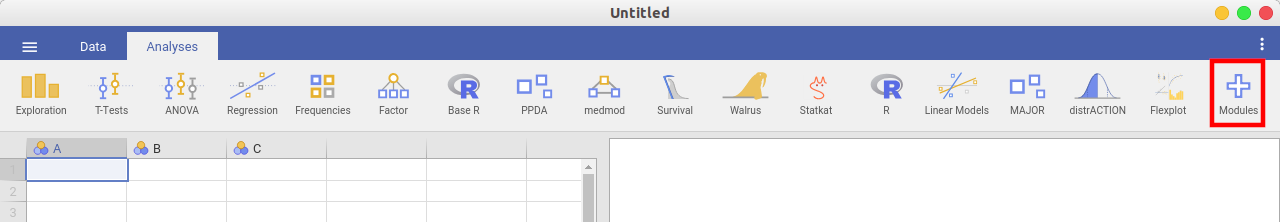
Schon auf den ersten Blick wird deutlich, dass jamovi derzeit weniger Funktionen hat als SPSS. ABER:
(1) There is a (ever increasing) made available via modules (press the „+“
sign in the right upper corner of the jamovi window to add them).
(2) The features implemented already cover „standard“ needs (90% of the
most frequently used analyses in psychology).
Schauen Sie sich ruhig an, welche Module verfügbar sind: Es gibt auch eine ganze Reihe von Modulen, die Funktionen abdecken, die in SPSS nicht verfügbar, aber sehr nützlich sind (z.B. für Meta-Analysen, Strukturgleichungsmodelle, etc.).
Wenn Sie bereit sind, etwas R-Code zu verwenden (z. B. in Verbindung mit dem jamovi-Modul Rj), können Sie (vermutlich) fast jede mögliche Analyse durchführen.
|
Reports (Berichte) |
|
Berichte → Codebuch |
N/A |
Reports → OLAP Cubes |
N/A |
Reports → Case summaries (Zusammenfassung von Fällen) |
Exploration → Descriptives hat die gleiche Funktionalität |
Reports → Reports Summaries in Rows |
N/A |
Reports → Reports Summaries in Columns |
N/A |
Deskriptivstatistik |
|
Descriptive Statistics → Frequencies (Häufigkeiten) |
Exploration → Descriptives enthält alle drei Analysen
wenn Sie „Frequency tables“ ankreuzen, erhalten Sie eine Ausgabe, die derjenigen von „Frequencies“ in SPSS ähnelt
|
Descriptive Statistics → Descriptives |
|
Descriptive Statistics → Explore |
|
Descriptive Statistics → Crosstabs (Kreuztabellen) |
Frequencies → (Contingency tables) → Independent samples (Kreuztabellen) |
Descriptive Statistics → Ratio |
N/A |
Bayessche Statistik |
erfordert das jamovi-Modul „jsq“ |
Bayesian Statistics → One Sample Normal |
T-Test → Bayesian One Sample T-Test |
Bayesian Statistics → One Sample Binomial |
Frequencies → Bayesian Proportion Test |
Bayesian Statistics → One Sample Poisson |
Frequencies → Bayesian Contingency Tables |
Bayesian Statistics → Related Sample Normal |
T-Test → Bayesian Paired Samples T-Test |
Bayesian Statistics → Independent Samples Normal |
T-Test → Bayesian Independent Samples T-Test |
Bayesian Statistics → Pearson Correlation |
Regression → Bayesian Correlation Matrix / Bayesian Correlation Pairs |
Bayesian Statistics → Linear Regression |
Regression → Bayesian Linear Regression |
Bayesian Statistics → One-way ANOVA |
ANOVA → Bayesian ANOVA (kann mehrere Faktoren enthalten / analysieren, während SPSS auf einen Faktor beschränkt ist) |
Bayesian Statistics → Log-Linear Models |
Frequencies → Bayesian Log-Linear Regression |
Mittelwerte vergleichen |
|
Compare Means → Means… |
Exploration → Descriptives ersetzt / integriert diese Funktion, wählen Sie das Dropdown-Menü „Statistics“ und setzen Sie die Häkchen bei „Mean“, „N“ und „Std. deviation“ |
Compare Means → Independent-Samples T Test |
T-Test → Independent Samples T-Test |
Compare Means → Paired-Samples T Test |
T-Test → Paired Samples T-Test |
Compare Means → One-Sample T Test |
T-Test → One Sample T-Test |
Compare Means → One-Way ANOVA |
ANOVA → One-Way ANOVA |
Allgemeines lineares Modell |
|
General Linear Model → Univariate |
ANOVA → One-Way ANOVA |
General Linear Model → Multivariate |
ANOVA → MANCOVA |
General Linear Model → Repeated Measures |
ANOVA → Repeated Measures ANOVA |
General Linear Model → Variance Components |
N/A |
Generalisierte lineare Modelle |
erfordert das jamovi-Modul „GAMLj“ |
Generalized Linear Models → Generalized Linear Models |
|
Generalized Linear Models → Generalized Estimating Equations |
|
Mixed Models |
erfordert das jamovi-Modul „GAMLj“ |
Mixed Models → Linear |
|
Mixed Models → Generalized Linear |
|
Korrelationen |
|
Correlate → Bivariate |
Regression → Correlation Matrix |
Correlate → Partial |
Regression → Partial Correlation |
Correlate → Distances |
N/A |
Regression |
|
Regression → Automatic Linear Models |
N/A |
Regression → Linear |
Regression → Linear Regression |
Regression → Ordinal |
Regression → (Logistic Regression) → Ordinal Outcomes |
Regression → Curve Estimation |
N/A |
Regression → Partial Least Squares |
N/A |
Loglinear |
|
Loglinear → General |
Frequencies → Log-Linear Regression |
Loglinear → Logit |
N/A |
Loglinear → Model Selection |
N/A |
Klassifizieren |
|
Classify → Nearest Neighbor |
N/A |
Classify → Discriminant |
N/A, kann mit R-code and the R-library «MASS» berechnet werden |
Classify → TwoStep Cluster |
N/A |
Classify → Hierarchical Cluster |
N/A, kann mit R-code and the R-library «pvclust» berechnet werden |
Classify → K-Means Cluster |
|
Dimensionsreduktion |
|
Dimension Reduction → Factor |
Factor → (Data reduction) → Principal Component Analysis
Factor → (Data reduction) → Exploratory Factor Analysis [1]
|
Skalen |
|
Scale → Reliability Analysis |
Factor → (Scale analysis) → Reliability analysis |
Scale → Multidimensional Scaling |
N/A |
Nichtparametrische Tests |
|
Nonparametric Tests → One Sample |
N/A, die Tests selbst sind verfügbar (siehe unten), aber kein gemeinsames Startmenü, das eine Auswahl auf der Grundlage Ihrer Daten ermöglicht (z. B. zwischen oder innerhalb von Probanden) |
Nonparametric Tests → Independent Samples |
|
Nonparametric Tests → Related Samples |
|
Nonparametric Tests → Legacy Dialogs → Chi-Square |
Frequencies → (One Sample Proportion Tests) → N Outcomes (x² goodness of fit) |
Nonparametric Tests → Legacy Dialogs → Binomial |
Frequencies → (One Sample Proportion Tests) → 2 Outcomes (Binomial test) |
Nonparametric Tests → Legacy Dialogs → Runs |
N/A |
Nonparametric Tests → Legacy Dialogs → 1-Sample K-S |
unter Exploration → Descriptives ist der Shapiro-Wilk-Test verfügbar (der ebenfalls auf Abweichung von der Normalverteilung prüft), wählen Sie das Dropdown-Menü „Statistik“ und kreuzen Sie „Shapiro-Wilk“ an (der Kolmogoroff-Smirnov-Test ist über das Zusatzmodul moretests verfügbar) |
Nonparametric Tests → Legacy Dialogs → 2 Independent Samples |
T-Test → Independent Samples T-Test, kreuzen Sie „Mann-Whitney U“ an |
Nonparametric Tests → Legacy Dialogs → 2 Related Samples |
T-Test → Paired Samples T-Test, kreuzen Sie „Wilcoxon Rank“ an |
Nonparametric Tests → Legacy Dialogs → K Independent Samples |
ANOVA → (Non-Parametric) → One-Way ANOVA (Kruskal-Wallis) |
Nonparametric Tests → Legacy Dialogs → K Related Samples |
ANOVA → (Non-Parametric) → Repeated Measures ANOVA (Friedman) |
Ereigniszeitanalyse |
benötigt das jamovi-Modul „Death watch“ |
Survival → Life Tables |
|
Survival → Kaplan-Meier |
|
Survival → Cox Regression |
|
Survival → Cox w/ Time-Dep Cov |
|
Mehrfachantworten |
|
Multiple Response → Define Variable Sets |
N/A |
Multiple Response → Frequencies |
|
Multiple Response → Crosstabs |
|
ROC Curve |
|
ROC Curve |
N/A, zugänglich über R-Pakete (z. B. ROCR oder pROC) |
Simulation |
|
Simulation |
N/A |
Spatial and Temporal Modeling (Räumliche und zeitliche Modellierung) |
|
Spatial and Temporal Modeling → Spatial Modeling |
N/A |