Autor da secção: Laiton Hedley
Filtering Data
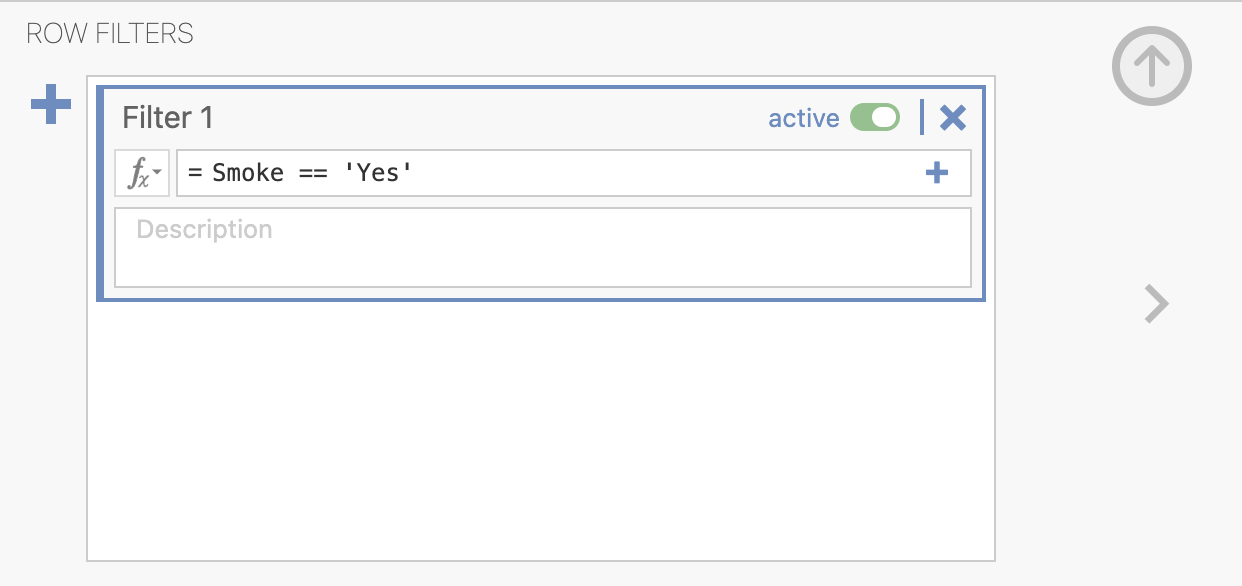
Often only a subset of data is needed for an analysis. For example, perhaps only participants who smoke are needed in an analysis. By clicking the data tab and selecting the filter icon, a filter is created and restricts any analyses to only those rows that meet the filter’s criteria.
The filer used above,
Smoke == 'Yes', has filtered out any participants who do not smoke or rather restricted the data set to only participants who smoke. Below is an example of how this filter has effected the data, the first column shows the rows that are included (with a tick) and which are excluded (with a cross):
Table 12 Example of Filtering Data Filter
Smoke
Outcome
✔
Yes
10
✘
No
4
✘
No
6
✔
Yes
9
✔
Yes
9
Only the data that has a tick (or rather participants who smoke) will be included in analyses and visualisations. It is possible to filter out based on multiple variables by using the
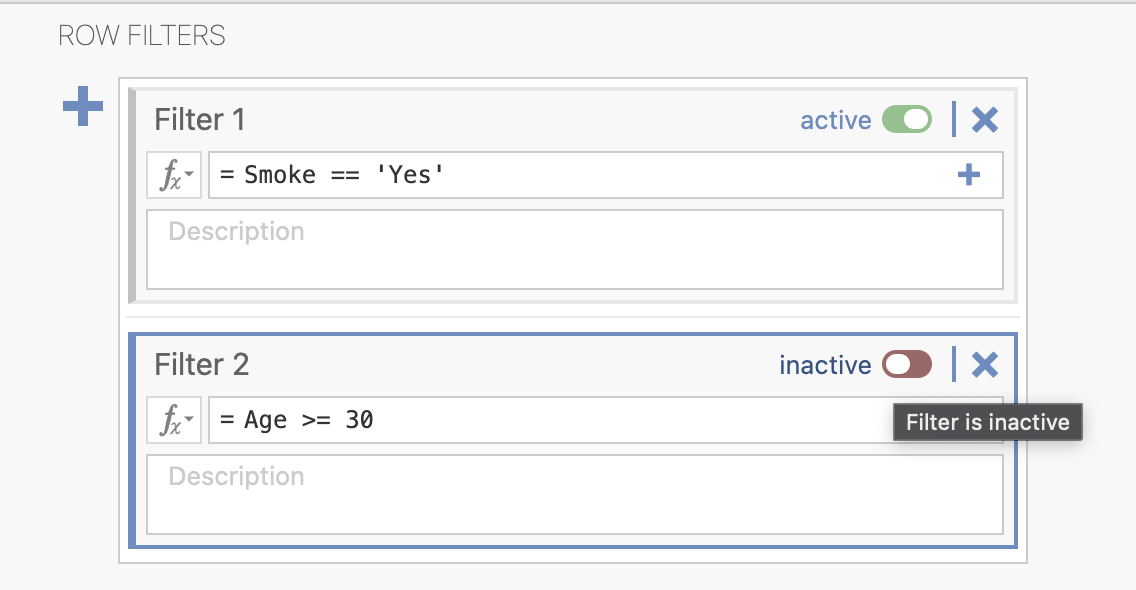
andandoroperators. For example, to filter based on Female Sex and Age of 30 and greater the following filter could be used:Sex == 'Female' and Age >= 30. The same principles can be applied fororconditions as well and if wishing to filter on the same variable multiple times.Alternatively, an additional filter can be created by clicking the plus icon in the filter editor. A second filter will appear below the first, and by adding the desired filter criteria such as
Age >= 30, the data will be filtered based on both filters. Additionally, we can toggle each filter on and off by clicking the toggle and switching it to active or inactive: