Autor da secção: Laiton Hedley
Overview
When analysing data, it is common for data to come in in a somewhat messy format. It’s often necessary to «tidy» and transform our data so that it is in a form suitable for our analyses. This may involve computing sum scores for each partipant, excluding outliers, recoding responses, transforming response variables to different scales, aggregation (such as computing mean response time for each participant), etc.
When raw data is first brought or entered into jamovi, it is represented in columns called Data Variables. This data can be analysed as-is, but it’s also possible to alter, recode and transform this data using Computed Variables and Transformed Variables. The fourth and final sort of column is Filters, used for filtering via categories or excluding outliers.
Data Variables
Data variables are simply the columns and rows of data brought or entered into jamovi. They typically represent the «raw data» that we want to use as a basis for our analyses. Opening a .csv file, or entering values directly into the spreadsheet will result in these values being represented in data variables.
Measure and Data Types
In jamovi, variables have a Measure type and a Data type to indicate the type of data contained in the variable and how it should be treated in analyses.
Data types can be either:
Integer: whole numbers without decimal points
Decimal: numbers with decimal points
Text: text, words, or «strings» that make up words or categories.
Note that jamovi does not support date and time data types at this time, however dates and times can be represented as text. Some basic date manipulations are described in Common Data Recipes.
Measure types are used to indicate the level of measurement.
Continuous: numbers where a continuum of values is meaningful, such as height, weight, counts.
Ordinal: discrete values where order is meaningful, i.e. “Strongly agree”, “Agree” … “< 18”, “18-30”, …
Nominal: discrete values with no meaningful order, i.e. Male, Female, … “Smoker”, “Non-smoker”, …
ID: unique identifiers for each row/participant.
Note that the levels of measurement don’t align perfectly with these types. jamovi follows a convention of combining ratio and interval into a single measure type Continuous. jamovi also provides an ID measure type for unique identifiers that are usually not analysed (i.e. Surname).
When data is first brought in, jamovi automatically assigns data types and measure types based on the form the data takes. Most of the time this automatic assignment will be correct, but there may be scenarios where the data type or measure type need to manually adjusted.
Note that some combinations of data type and measure type are not possible (e.g., a variable cannot be both text and continuous, or decimal and nominal).
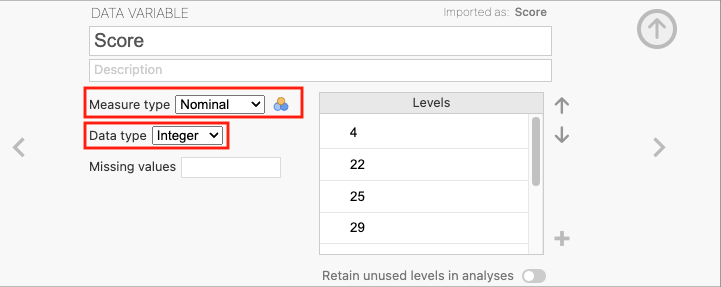
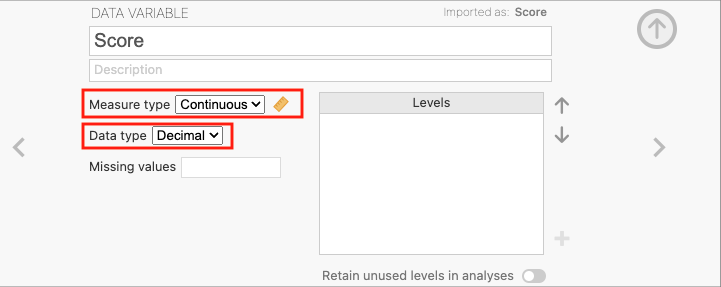
To change the data type and measure type of a variable, double click on the column header to open the variable editor. Here the variable’s name, description, data type, and measure type can be seen and modified. Click on the measure type a drop down menu will appear with the options to change the measure type. To change the data type, click on the data type and select the desired data type from the drop down menu. For example, below is the variable editor for a variable called Score (representing some continuous percentage of performance) which incorrectly shows as Nominal data type with an Ordinal measure type:
To change this to continuous, click on the measure type and select «Continuous» from the drop-down menu. Similarly, to change the data type to decimal, click on the data type and select «Decimal» from the drop-down menu.
Now jamovi treats this variable as a continuous variable. This is important for performing analyses that require continuous data (such as a correlation or regression) or if we wish to perform mathematical operations on the variable (such as computing a z-score).
Missing Values
Often data will contain missing values, jamovi provides a number of options to handle missing values. In jamovi, missing values are represented as blank cells in the data view.
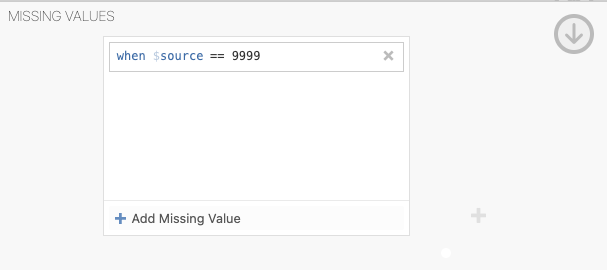
Some data sets use special values to encode missing values, for example, they may use the value -99 or 9999. This data, left as-is, will be treated by analyses as actual values. In order for these to be treated as missing values, it’s necessary to instruct jamovi to treat these values as missing.
With variable editor open, click on
Missing valuesand a window will appear, click theAdd Missing Valuebutton. Now, it is possible to specify when the source or rather the variable of interest has a value exactly, equal to, less than, or greater than a value, it should be treated as a missing value.For example, the formula of
== 9999shown below means that any values equal to 9999 will be treated as missing values.
Adding Labels to Levels
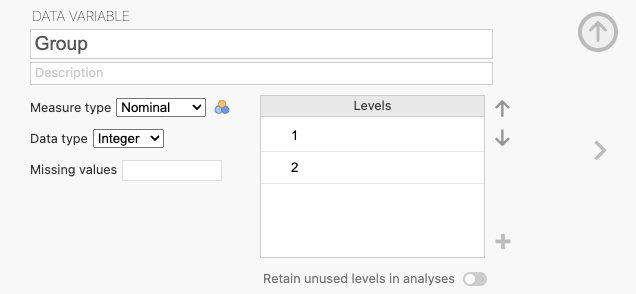
For variables with a nominal or ordinal measure type, it is possible to add labels to the levels of the variable: Below is a table of data with a variable called «Group» which has a nominal measure type and integer data type.
Table 1 Example of a Variable with Unlabeled Levels ID
Group
1
1
2
2
3
1
4
2
The levels of 1 and 2 indicate whether the participant is a smoker or not, but these values are not very informative: Through the data variable editor levels 1 and 2 are presented for this variable:
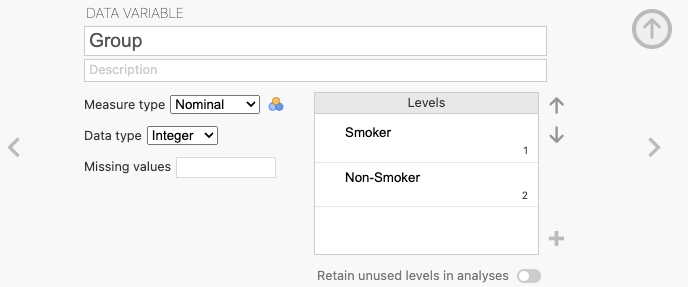
By clicking on the 1 and 2 in our variable editor, meaningful labels can be assigned to these levels - such as «Smoker» and «Non-smoker», respectively:
Allowing us to have a more informative variable with the following data:
Table 2 Example of a Variable with Labeled Levels ID
Group
1
Smoker
2
Non-smoker
3
Smoker
4
Non-smoker
Now, when performing analyses, the labels «Smoker» and «Non-smoker» will be used instead of the values 1 and 2, making the results more informative and easier to interpret.
Reordering Levels
For Ordinal Data (and at times Nominal Data), we may wish to «reorder» the levels in which the data appear in Figures and Tables.
Below is an example table of descriptive data computed via jamovi to begin inferring differences within a data set.
Table 3 Example Descriptives Table with Levels Unordered Task Difficulty
Mean
Standard Deviation
Low
85.1
9.5
High
54.3
9.1
Medium
73.6
9.3
Each row represents one of three levels of Task Difficulty (Low, Medium, High) in a Memory Task, with columns to indicate the Mean and Standard deviation. However, the order in which the rows are presented is unintuitive, the High condition is in the middle and the natural order is interrupted.
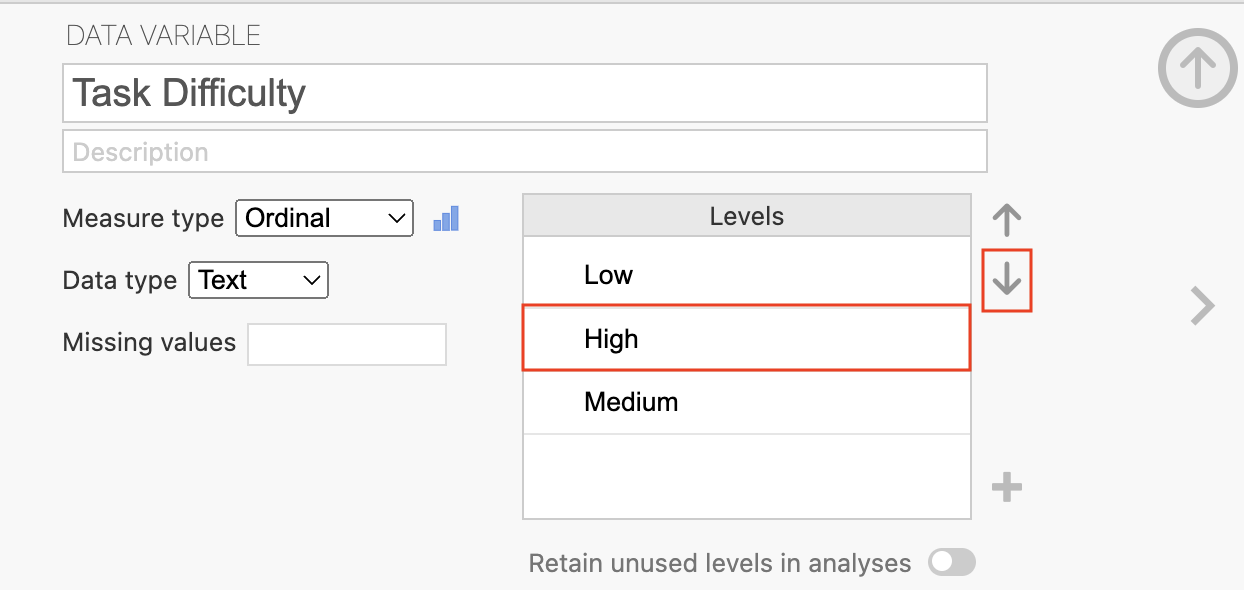
Jamovi can allow for the reordering of variables, so in all future Tables and Figures the levels appear in a more intuitive order; Low, Medium, then High. To do this, double click on variable of interest to open the variable editor. Here, the Levels (such as the Low, High, and Medium) for a Variable (like Task Difficulty) can be seen:
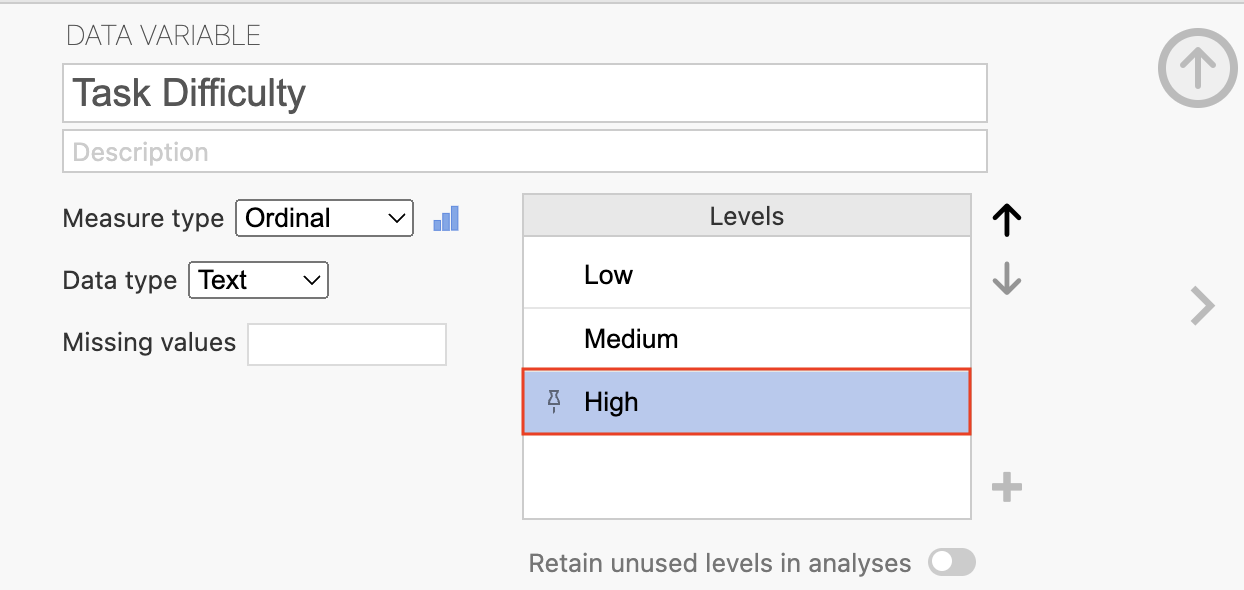
Click on the level to reorder and use the arrow keys to move the level to an appropriate location in the heirarchy (the level at the top will be positoned at the left most or top position and bottom level will be position in the right most or lowest position for all future tables and figures):
The descriptive table (and any following figures) will present the levels in the same order as indicated in the variable editor. For example, the table below now displays each level of Task Difficulty from Low to High in an intuitive fashion.
Table 4 Example Descriptives Table with Levels Reordered Task Difficulty
Mean
Standard Deviation
Low
85.1
9.5
Medium
73.6
9.3
High
54.3
9.1
The natural order of the conditions is now preserved, moving down each row it appears in the order of Low, Medium, then High, making the table easier to read and interpret.
Retain Unused Levels in Analyses
Some categorical variables have valid levels that do not appear in the current data set. These unused levels may still be meaningful and can be retained for analysis or reporting. For example, a survey may ask adult and child moviegoers whether they enjoyed a film, with responses of Yes or No. If all participants answer Yes, the No level is absent from the data (even though it remains a valid response option):
Table 5 Example of a Data with an Unused Level Age Group:
Enjoyed Film (Y/N):
Adult
Yes
Adult
Yes
Adult
Yes
Child
Yes
Child
Yes
Child
Yes
If a contingency table was used to examine the relationship between Age Group and Film Enjoyment, there is a problem because «No» responses are absent from the data. Without this in our data the contingency table would not be able to represent the missing («No») level of the variable.
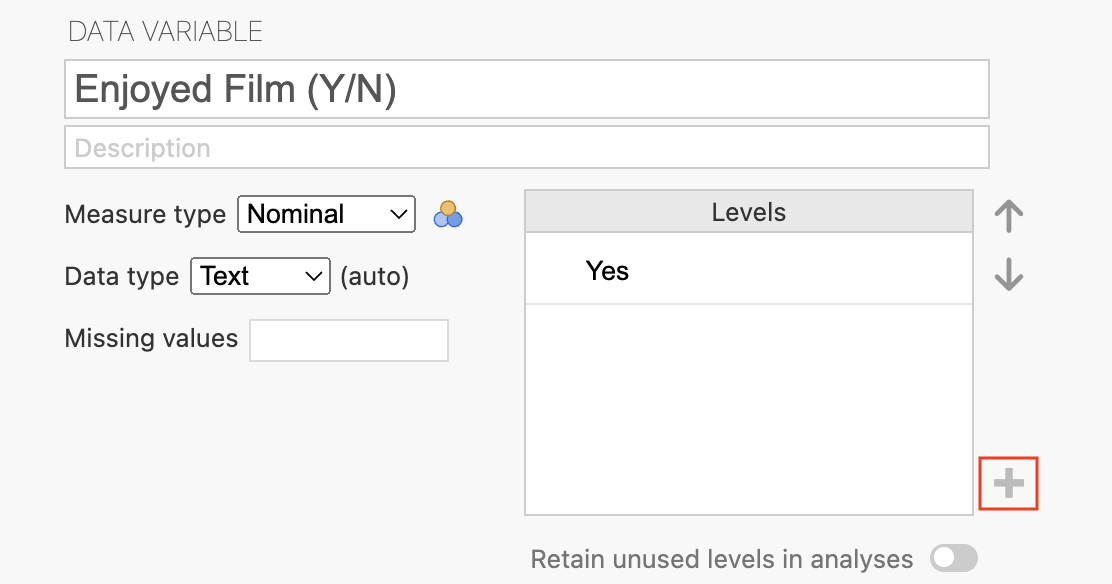
To ensure this level is retained in analyses, first the unused level (e.g., «No») must be added to the variable editor for the variable of interest (e.g., Enjoyed Film (Y/N)) by double clicking in the heading of the variable or clicking a cell of the variable the variable editor will appear and with a plus sign towards the bottom of the variable editor:
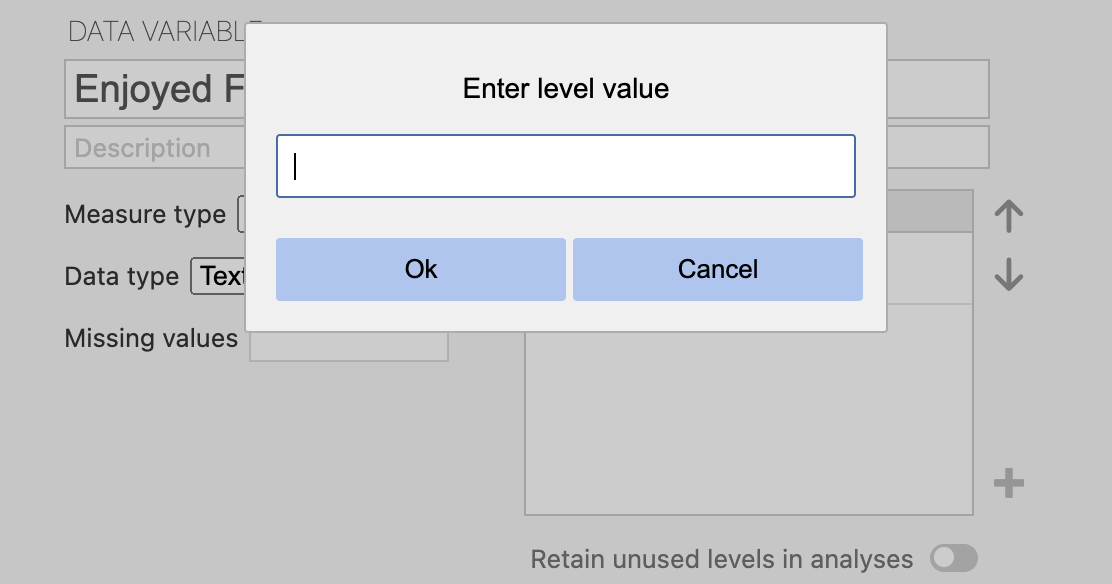
Click the plus sign to add the unused level (of «No») in the variable editor and entering the text for the unused level:
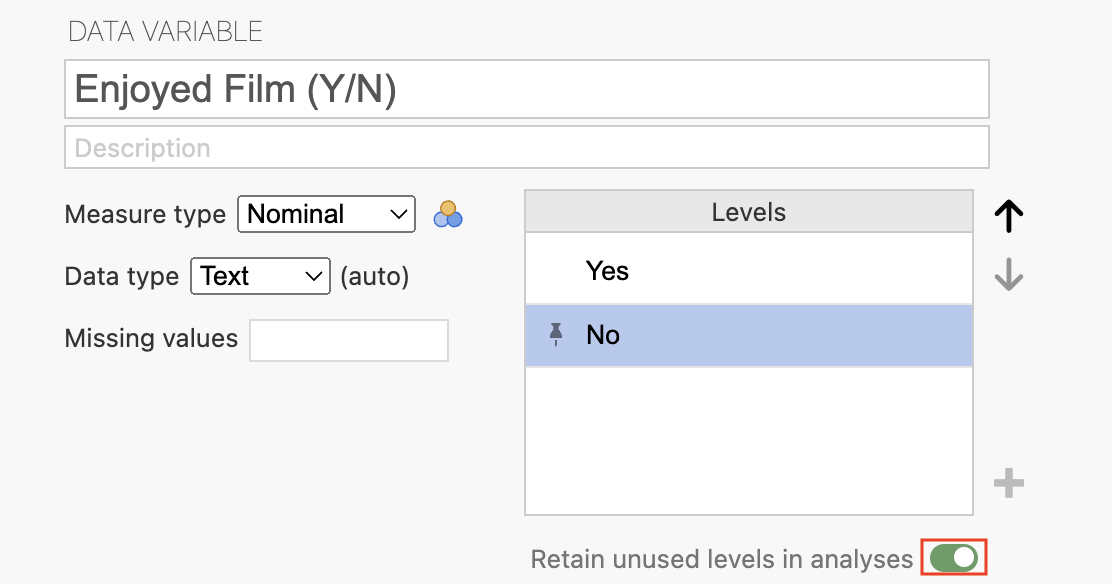
The unused level (of «No») is included as a level for the variable of interest (Enjoyed Film (Y/N)), but it is not yet retained in analyses. To retain this level in analyses, click the toggle on button next to the text: «Retain unused levels in analyses» option:
Now, when performing analyses, the «No» level will be retained in analyses and represented in tables and figures, even though there is an absence of «No» responses in the data.