Section author: Sebastian Jentschke
From SPSS to jamovi: t-test for independent samples
This comparison shows how a t-test for independent samples is performed in SPSS and jamovi. How the test is conducted in SPSS follows the description in chapter 10.8 of Field (2017), especially Figure 10.4 and Output 10.3 - 10.4. It uses the data set Invisibility.sav which can be downloaded from the web page accompanying the book.
| SPSS | jamovi |
|---|---|
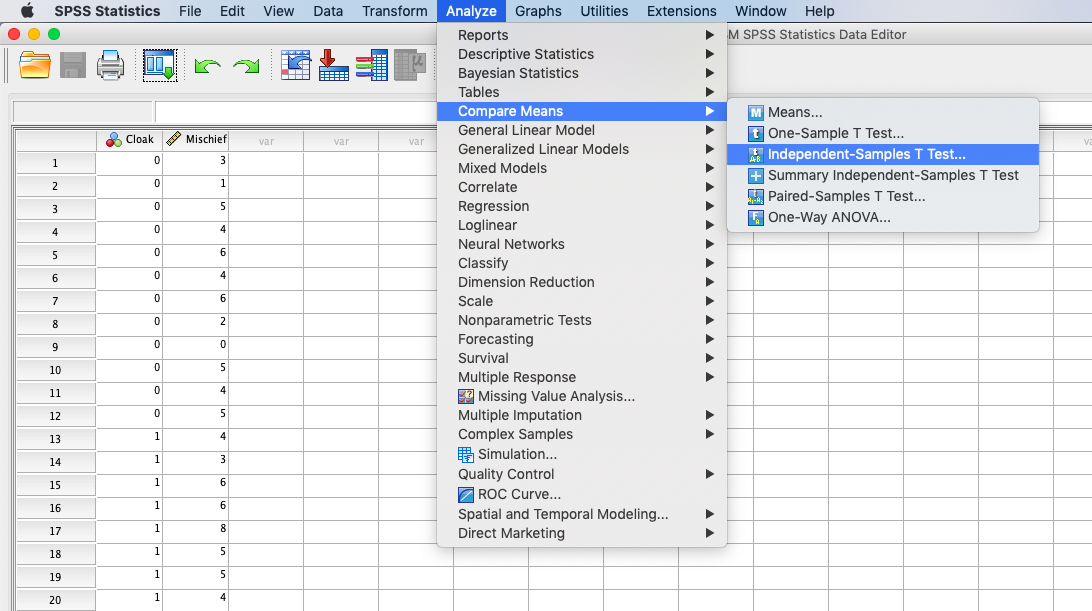
In SPSS you can run an independent t-test using: Analyze → Compare
Means → Independent Samples T-test |
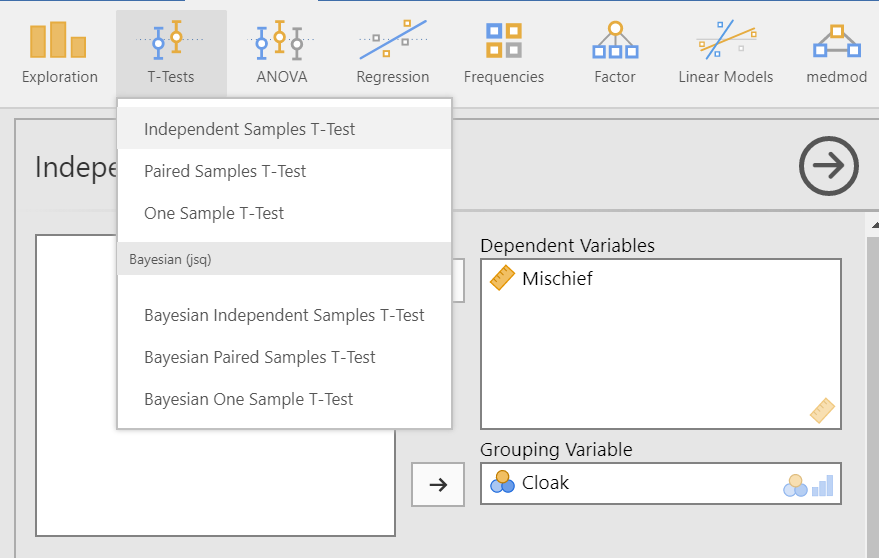
In jamovi you do this using: Analyses (tab) → T-Tests →
Independent Samples T-Test |
 |
 |
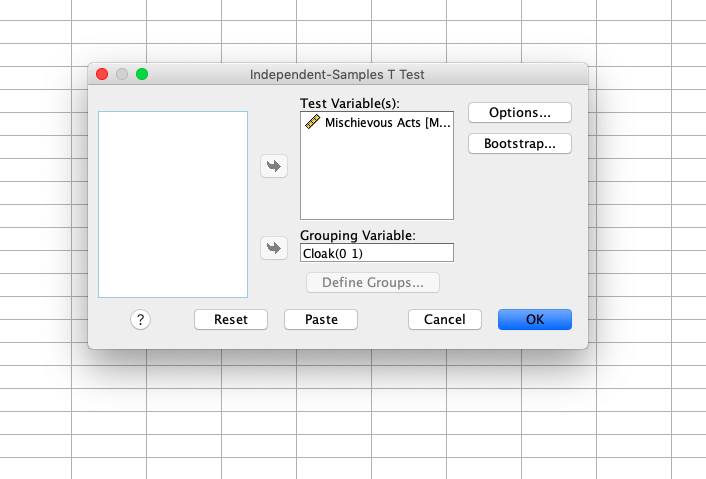
In SPSS, Mischevious acts is moved to the variable box Test
variables(s) and Cloak of invisibility to variable box Grouping
variables. Afterwards, press the button Define Groups... (underneath
the variable box Grouping variables) and enter 0 under Group 1
and 1 under Group 2. |
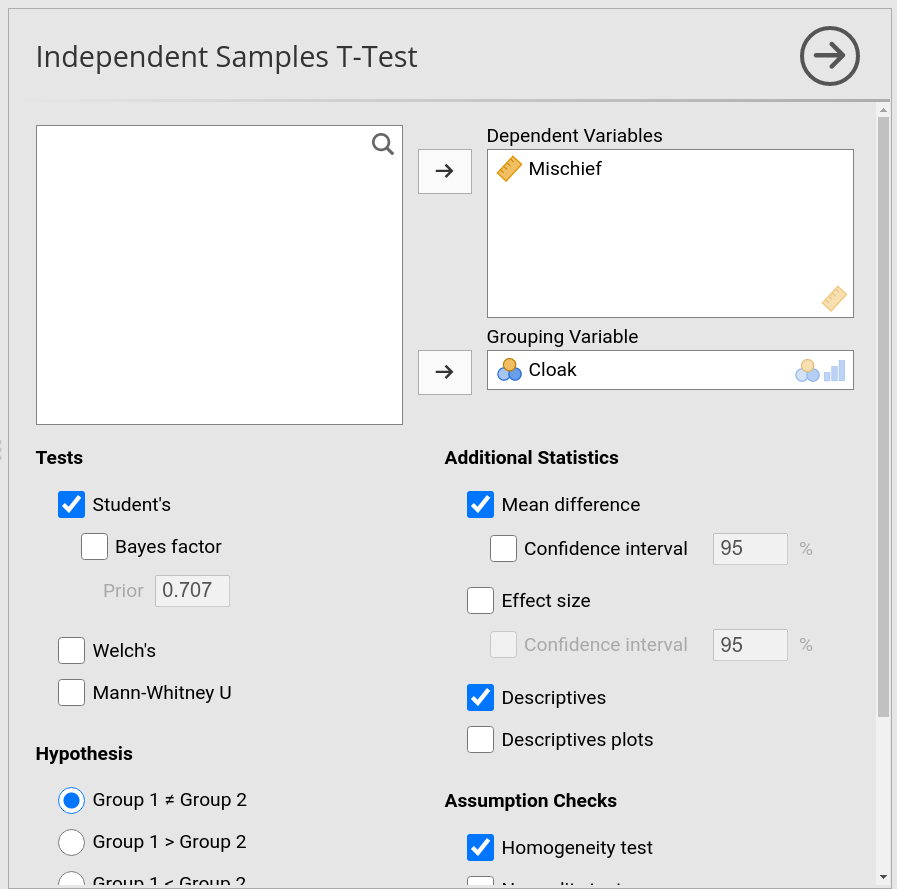
In jamovi, the variable Mischief is moved to the variable box Dependent
Variable(s), and the variable Cloak is moved to the variable box
Grouping Variable. If you wish to obtain an identical output to SPSS, one
has to switch on the Levene’s Test for the Equality of Variances, by ticking
Homogeneity Test under Assumption Checks; the table with the
descriptive statistics for the two groups can be selected by ticking
Descriptives under Additional Statistics. |
 |
 |
| If one compares the outputs of SPSS and jamovi, the results are the same. However, the output of jamovi appears much clearer. The main results can be found in slightly different places in SPSS and jamovi. | |
 |
 |
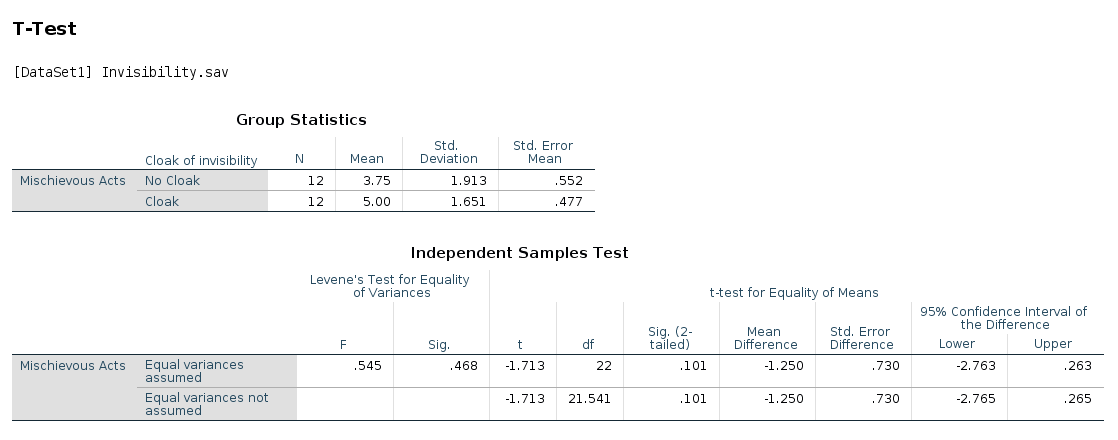
In SPSS, the output table Independent Samples T-Test starts with Levene’s
Test for the Equality of Variances. If it is NOT significant (p > 0.05),
one can use the results from the first line (Equal variances assumed),
otherwise, you have to use the results from the second line (Equal
variances not assumed). |
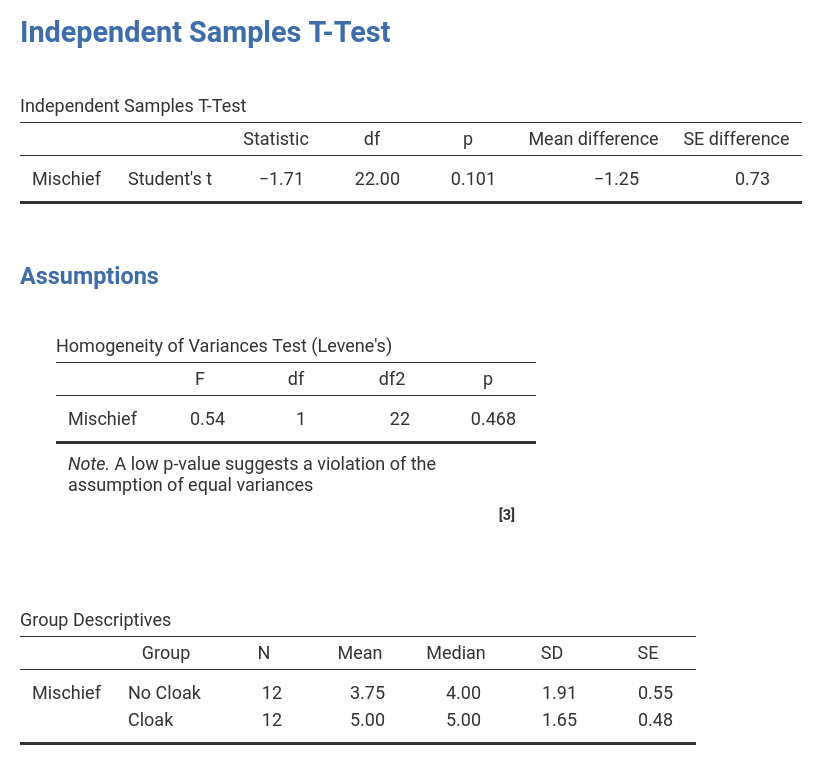
If the p-value in the table Homogeneity of Variances Test (Levene's) is
significant (p < 0.05), then you have to correct for that inhomogeneity. To
do so, untick Student's and tick Welch's instead (under Test in
the input panel). The results described underneath can be found in the first
table Independent Samples T-Test. |
The t-value can be found in the third column ( The numerical values for the statistics are identical: t = -1.71, df = 22, p = 0.101. |
|
| If you wish to replicate those analyses using syntax, you can use the commands below (in jamovi, just copy to code below to Rj). Alternatively, you can download the SPSS output files and the jamovi files with the analyses from below the syntax. | |
T-TEST GROUPS=Cloak(0 1)
   /VARIABLES=Mischief
   /CRITERIA=CI(.95)
   /MISSING=ANALYSIS.
|
jmv::ttestIS(
    data = data,
    formula = Mischief ~ Cloak,
    desc = TRUE,
    eqv = TRUE)
|
| SPSS output file containing the analyses | jamovi file with the analyses |
References
Field, A. (2017). Discovering statistics using IBM SPSS statistics (5th ed.). SAGE Publications. https://edge.sagepub.com/field5e