章節作者:Sebastian Jentschke
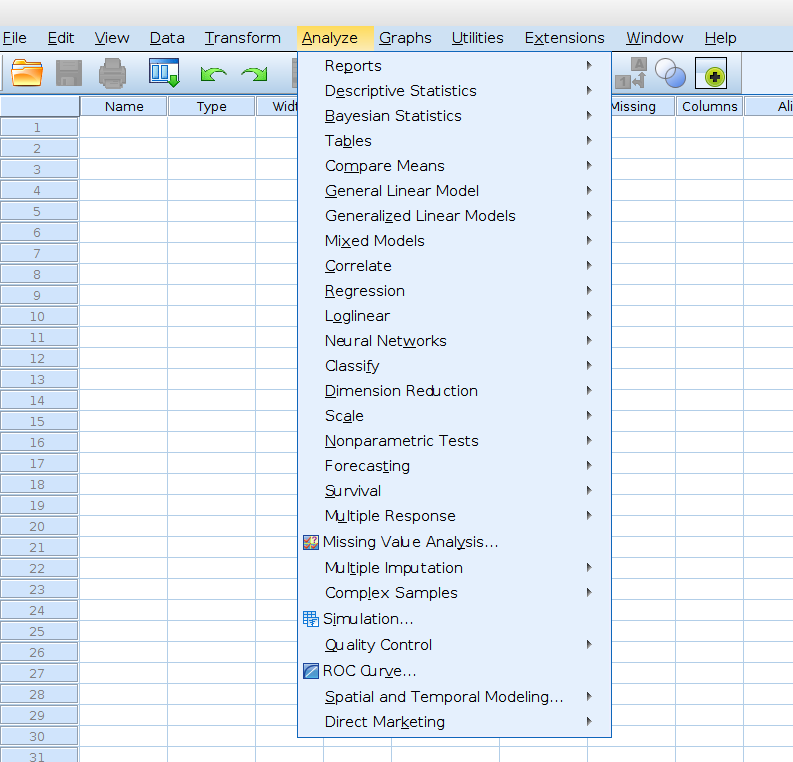
Comparison of Which Analyses Are Available in SPSS and jamovi
SPSS |
jamovi |
|---|---|
|
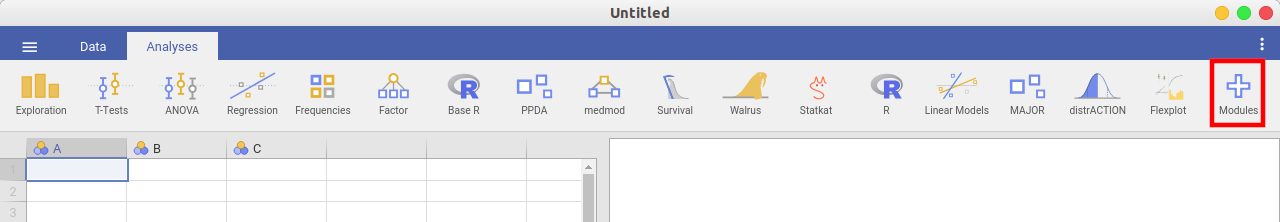
Already at first glance, it becomes clear that jamovi currently has fewer
features than SPSS. BUT:
(1) There is a (ever increasing) made available via modules (press the 「+」
sign in the right upper corner of the jamovi window to add them).
(2) The features implemented already cover 「standard」 needs (90% of the
most frequently used analyses in psychology).
Feel free to check out which modules are available: There is also quite a
wealth of modules covering functions that are not available in SPSS but
very useful (e.g., for meta-analyses, structural equation models, etc.).
If you are willing to use some R code (e.g., in conjunction with the
jamovi-module Rj) then you can (most presumably) do every analysis you
can imagine.
|
Reports |
|
Reports → Codebook |
N/A |
Reports → OLAP Cubes |
N/A |
Reports → Case summaries |
Exploration → Descriptives has the same functionality |
Reports → Reports Summaries in Rows |
N/A |
Reports → Reports Summaries in Columns |
N/A |
Descriptive Statistics |
|
Descriptive Statistics → Frequencies |
Exploration → Descriptives combines all three procedures
tick «Frequency tables» to get an output that is similar to that of
«Frequencies» in SPSS
|
Descriptive Statistics → Descriptives |
|
Descriptive Statistics → Explore |
|
Descriptive Statistics → Crosstabs |
Frequencies → (Contingency tables) → Independent samples |
Descriptive Statistics → Ratio |
N/A |
Bayesian Statistics |
requires the jamovi-module «jsq» |
Bayesian Statistics → One Sample Normal |
T-Test → Bayesian One Sample T-Test |
Bayesian Statistics → One Sample Binomial |
Frequencies → Bayesian Proportion Test |
Bayesian Statistics → One Sample Poisson |
Frequencies → Bayesian Contingency Tables |
Bayesian Statistics → Related Sample Normal |
T-Test → Bayesian Paired Samples T-Test |
Bayesian Statistics → Independent Samples Normal |
T-Test → Bayesian Independent Samples T-Test |
Bayesian Statistics → Pearson Correlation |
Regression → Bayesian Correlation Matrix / Bayesian Correlation Pairs |
Bayesian Statistics → Linear Regression |
Regression → Bayesian Linear Regression |
Bayesian Statistics → One-way ANOVA |
ANOVA → Bayesian ANOVA (can handle several factors while SPSS is limited to one factor) |
Bayesian Statistics → Log-Linear Models |
Frequencies → Bayesian Log-Linear Regression |
Compare Means |
|
Compare Means → Means… |
Exploration → Descriptives replaces / integrates that functionality, choose the drop-down menu «Statistics» and set ticks at «Mean», «N» and «Std. deviation» |
Compare Means → Independent-Samples T Test |
T-Test → Independent Samples T-Test |
Compare Means → Paired-Samples T Test |
T-Test → Paired Samples T-Test |
Compare Means → One-Sample T Test |
T-Test → One Sample T-Test |
Compare Means → One-Way ANOVA |
ANOVA → One-Way ANOVA |
General Linear Model |
|
General Linear Model → Univariate |
ANOVA → One-Way ANOVA |
General Linear Model → Multivariate |
ANOVA → MANCOVA |
General Linear Model → Repeated Measures |
ANOVA → Repeated Measures ANOVA |
General Linear Model → Variance Components |
N/A |
Generalized Linear Models |
requires the jamovi-module «GAMLj» |
Generalized Linear Models → Generalized Linear Models |
|
Generalized Linear Models → Generalized Estimating Equations |
|
Mixed Models |
requires the jamovi-module «GAMLj» |
Mixed Models → Linear |
|
Mixed Models → Generalized Linear |
|
Correlate |
|
Correlate → Bivariate |
Regression → Correlation Matrix |
Correlate → Partial |
Regression → Partial Correlation |
Correlate → Distances |
N/A |
Regression |
|
Regression → Automatic Linear Models |
N/A |
Regression → Linear |
Regression → Linear Regression |
Regression → Ordinal |
Regression → (Logistic Regression) → Ordinal Outcomes |
Regression → Curve Estimation |
N/A |
Regression → Partial Least Squares |
N/A |
Loglinear |
|
Loglinear → General |
Frequencies → Log-Linear Regression |
Loglinear → Logit |
N/A |
Loglinear → Model Selection |
N/A |
Classify |
|
Classify → Nearest Neighbor |
N/A |
Classify → Discriminant |
N/A, can be calculated using R-code and the R-library «MASS» |
Classify → TwoStep Cluster |
N/A |
Classify → Hierarchical Cluster |
N/A, can be calculated using R-code and the R-library «pvclust» |
Classify → K-Means Cluster |
|
Dimension Reduction |
|
Dimension Reduction → Factor |
Factor → (Data reduction) → Principal Component Analysis
Factor → (Data reduction) → Exploratory Factor Analysis [1]
|
Scale |
|
Scale → Reliability Analysis |
Factor → (Scale analysis) → Reliability analysis |
Scale → Multidimensional Scaling |
N/A |
Nonparametric Tests |
|
Nonparametric Tests → One Sample |
N/A, the tests itself are available (see below), but not a common start menu that allows a selection based on your data (e.g., between- or within-subject) |
Nonparametric Tests → Independent Samples |
|
Nonparametric Tests → Related Samples |
|
Nonparametric Tests → Legacy Dialogs → Chi-Square |
Frequencies → (One Sample Proportion Tests) → N Outcomes (x² goodness of fit) |
Nonparametric Tests → Legacy Dialogs → Binomial |
Frequencies → (One Sample Proportion Tests) → 2 Outcomes (Binomial test) |
Nonparametric Tests → Legacy Dialogs → Runs |
N/A |
Nonparametric Tests → Legacy Dialogs → 1-Sample K-S |
Shapiro-Wilks available under Exploration → Descriptives, choose drop-down menu «Statistics» and tick «Shapiro-Wilks» (Kolmogoroff-Smirnov available via the additional module moretests) |
Nonparametric Tests → Legacy Dialogs → 2 Independent Samples |
T-Test → Independent Samples T-Test, set tick-box «Mann-Whitney U» |
Nonparametric Tests → Legacy Dialogs → 2 Related Samples |
T-Test → Paired Samples T-Test, set tick-box «Wilcoxon Rank» |
Nonparametric Tests → Legacy Dialogs → K Independent Samples |
ANOVA → (Non-Parametric) → One-Way ANOVA (Kruskal-Wallis) |
Nonparametric Tests → Legacy Dialogs → K Related Samples |
ANOVA → (Non-Parametric) → Repeated Measures ANOVA (Friedman) |
Survival |
requires the jamovi-module «Death watch» |
Survival → Life Tables |
|
Survival → Kaplan-Meier |
|
Survival → Cox Regression |
|
Survival → Cox w/ Time-Dep Cov |
|
Multiple Response |
|
Multiple Response → Define Variable Sets |
N/A |
Multiple Response → Frequencies |
|
Multiple Response → Crosstabs |
|
ROC Curve |
|
ROC Curve |
N/A, accessible via R packages (e.g., ROCR eller pROC) |
Simulation |
|
Simulation |
N/A |
Spatial and Temporal Modeling |
|
Spatial and Temporal Modeling → Spatial Modeling |
N/A |